A shapefile of gridded squares for French urban centre 200 metre grid with following fields:id: Identifier unique to this urban centre population: Global Human Settlement Layer population estimate within 200 metre cellgeometry: Grid polygons within_uc: Whether the 200 metre cell is within the defined urban centreaccess_pop: The median sum population that can be reached from the centroid of the 200 metre cell within a 45 minute commute by walking, bus and trainproxim_pop: The sum proximal population within an 11.25 kilometre radius of the centroid of the 200 metre celltrans_perf: The transport performance of the 200 metre cell. The percentage ratio of accessible to proximal populationcity_nm: Name of the urban centrecountry_nm: Name of the country that the urban centre belongs to
The dataset captures Disability Standards for Accessible Public Transport compliance at railway stations and wharves across NSW. In the first release, files in csv format, contains site audit or consolidation exercise data for Lifts at railway stations. Additional data includes TSN, location description, latitude/longitude, and asset ID that matches to Sydney Trains Lift ID. There will be a gradual roll out of other transit stop elements such as accessible car parks, accessible and ambulant toilets, lifts, pedestrian crossings, platforms, retail spaces and ticket machines. Disclaimers: (1) The field ‘is\_this\_a\_consolidation\_exercise\_or\_a\_site\_audit’ indicates how the data is obtained. Data from a consolidation exercise (desktop audit) is not as accurate as a site audit. (2) The data reflects a point in time and may not reflect works that have been completed since the ‘updated\_at’ date.
This web app allows the user to view which Washington State public recreation lands have ADA accessible recreational features. Categories of ADA accessible features include Camping, Hiking, Restrooms, Trails, and many others. Users can either click on a ADA information point (represented by a colored conifer tree icon) and get a listing of ADA accessible features, or run a query that selects properties that meet the chosen criteria.
Points that hold information relating to the ADA (Americans with Disabilities Act)-related recreational features available at Washington State Parks. These points indicate which state parks contain which types of recreational features that are compliant with ADA requirements. For specifics about features, see the park's web page (hyperlink available by clicking on the point). This layer is used in the web application ADA Accessible Features Finder. To download this and other data from Washington State Parks, go to geo.wa.gov and search for "wsprc" (Washington State Parks and Recreation Commission).
PTAL is a measure of connectivity by public transport, which has been used in various planning processes for many years. For any selected place, PTAL suggests how well the place is connected to public transport services. It does not cover trips by car. The PTAL model calculates December 2019 public transport accessibility for every 2016 ABS Mesh Block in New South Wales. The TfNSW PTAL model is based on the Transport for London (TfL) PTAL and was adapted for TfNSW in collaboration with the Spatial Information Science team at the Department of Earth and Environmental Sciences, Macquarie University. The [Assessing transport connectivity in London](http://content.tfl.gov.uk/connectivity-assessment-guide.pdf) explains what PTAL is, how to understand the data and more. PTAL values are simple. They range from zero to six, where the highest value represents the best connectivity. A location will have a higher PTAL if: \* It is at a short walking distance to the nearest stations or stops \* Waiting times at the nearest stations or stops are short \* More services pass at the nearest stations or stops \* There are major rail stations nearby \* Any combination of all the above. Please read the PTAL documentation for more information. The format of the data is Arcgis geodatabase. **Images below show an example of what the data looks like at 8:00am (first image) and 1:00am (second image)**. 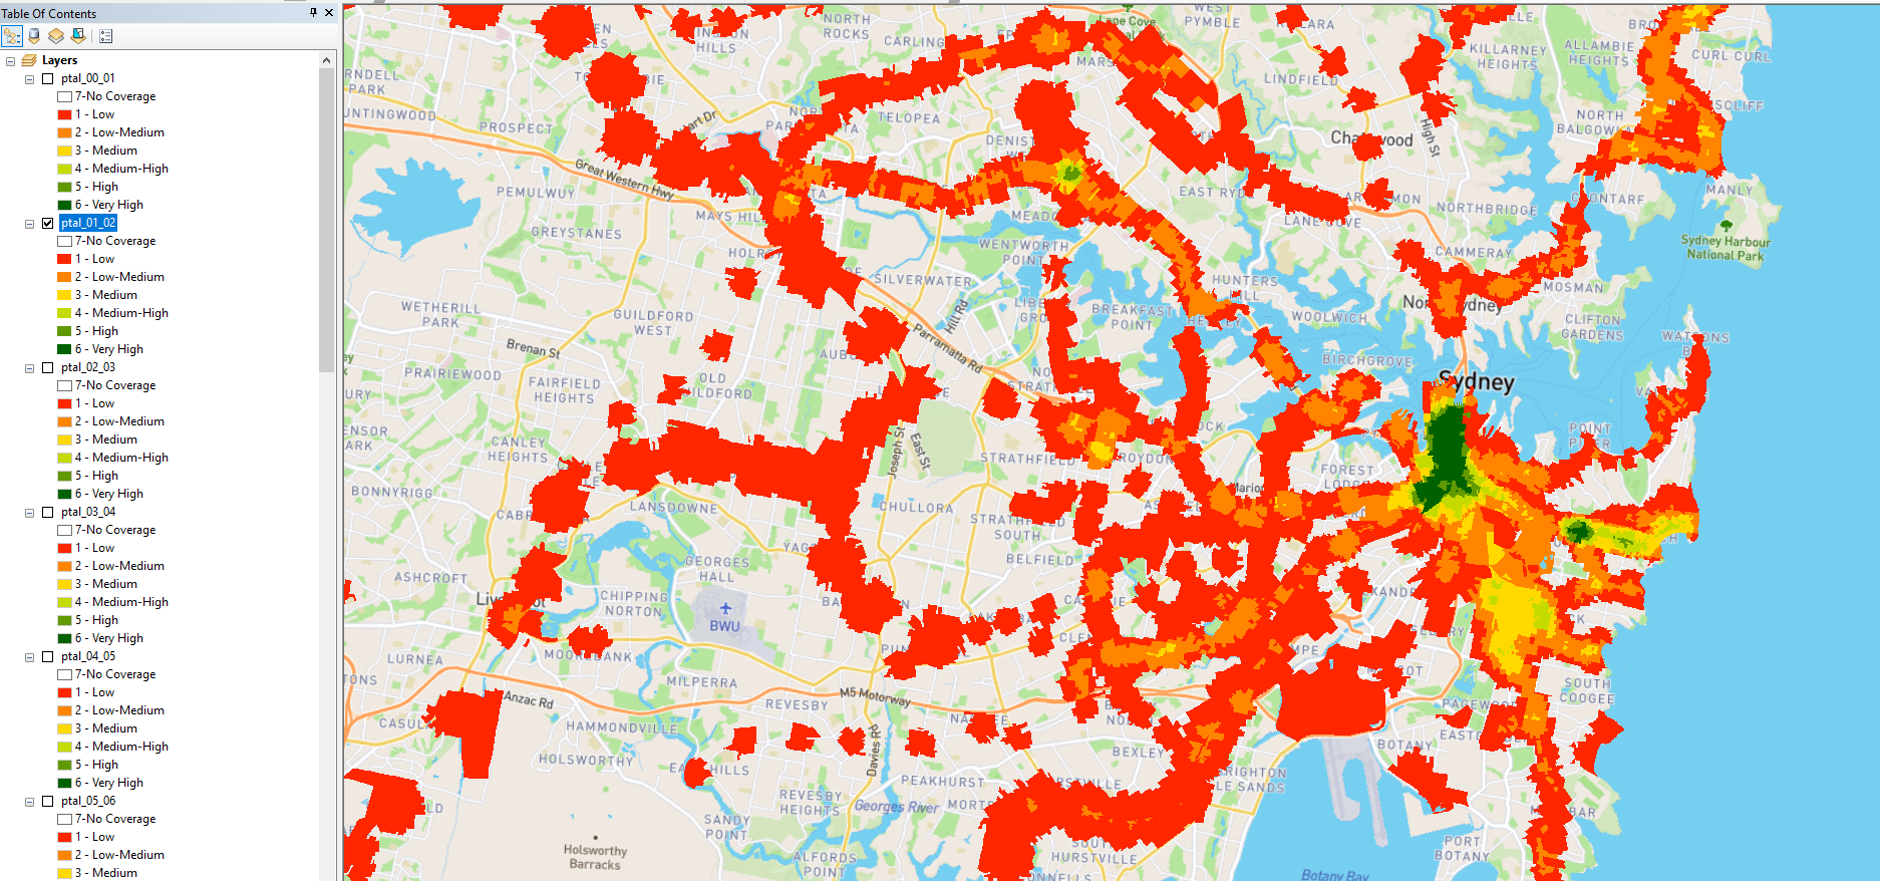
Experimental public transit transport performance statistics by 200 metre grids for a subset of urban centres in France, with the following fields (Note: These data are experimental, please see the Methods and Known Limitations/Caveats Sections for more details).AttributeDescriptionidUnique IdentifierpopulationGlobal Human Settlement Layer population estimate downsampled to 200 metre (represents the total population across adjacent 100 metre cells)access_popThe total population that can reach the destination cell within 45 minutes using the public transit network (origins within 11.25 kilometres of the destination cell)proxim_popThe total population within an 11.25 kilometre radius of the destination celltrans_perfThe transport performance of the 200 metre cell. The percentage ratio of accessible to proximal populationcity_nmName of the urban centrecountry_nmName of the country that the urban centre belongs toMethods: For more information please visit: · Python Package: https://github.com/datasciencecampus/transport-network-performance · Docker Image: https://github.com/datasciencecampus/transport-performance-docker Known Limitations/Caveats: These data are experimental – see the ONS guidance on experimental statistics for more details. They are being published at this early stage to involve potential users and stakeholders in assessing their quality and suitability. The known caveats and limitations of these experimental statistics are summarised below. Urban Centre and Population Estimates: · Population estimates are derived from data using a hybrid method of satellite imagery and national censuses. The alignment of national census boundaries to gridded estimates introduce measurement errors, particularly in newer housing and built-up developments. See section 2.5 of the GHSL technical report release 2023A for more details. Public Transit Schedule Data (GTFS): · Does not include effects due to delays (such as congestion and diversions). · Common GTFS issues are resolved during preprocessing where possible, including removing trips with unrealistic fast travel between stops, cleaning IDs, cleaning arrival/departure times, route name deduplication, dropping stops with no stop times, removing undefined parent stations, and dropping trips, shapes, and routes with no stops. Certain GTFS cleaning steps were not possible in all instances, and in those cases the impacted steps were skipped. Additional work is required to further support GTFS validation and cleaning. Transport Network Routing: · “Trapped” centroids: the centroid of destination cells on very rare occasions falls on a private road/pathway. Routing to these cells cannot be performed. This greatly decreases the transport performance in comparison with the neighbouring cells. Potential solutions include interpolation based on neighbouring cells or snapping to the nearest public OSM node (and adjusting the travel time accordingly). Further development to adapt the method for this consideration is necessary. Please also visit the Python package and Docker Image GitHub issues pages for more details. How to Contribute: We hope that the public, other public sector organisations, and National Statistics Institutions can collaborate and build on these data, to help improve the international comparability of statistics and enable higher frequency and more timely comparisons. We welcome feedback and contribution either through GitHub or by contacting datacampus@ons.gov.uk.
Experimental public transit transport performance statistics by 200 metre grids for a subset of urban centres in Great Britain, with the following fields (Note: These data are experimental, please see the Methods and Known Limitations/Caveats Sections for more details).AttributeDescriptionidUnique IdentifierpopulationGlobal Human Settlement Layer population estimate downsampled to 200 metre (represents the total population across adjacent 100 metre cells)access_popThe total population that can reach the destination cell within 45 minutes using the public transit network (origins within 11.25 kilometres of the destination cell)proxim_popThe total population within an 11.25 kilometre radius of the destination celltrans_perfThe transport performance of the 200 metre cell. The percentage ratio of accessible to proximal populationcity_nmName of the urban centrecountry_nmName of the country that the urban centre belongs toMethods: For more information please visit: · Python Package: https://github.com/datasciencecampus/transport-network-performance · Docker Image: https://github.com/datasciencecampus/transport-performance-docker Known Limitations/Caveats: These data are experimental – see the ONS guidance on experimental statistics for more details. They are being published at this early stage to involve potential users and stakeholders in assessing their quality and suitability. The known caveats and limitations of these experimental statistics are summarised below. Urban Centre and Population Estimates: · Population estimates are derived from data using a hybrid method of satellite imagery and national censuses. The alignment of national census boundaries to gridded estimates introduce measurement errors, particularly in newer housing and built-up developments. See section 2.5 of the GHSL technical report release 2023A for more details. Public Transit Schedule Data (GTFS): · Does not include effects due to delays (such as congestion and diversions). · Common GTFS issues are resolved during preprocessing where possible, including removing trips with unrealistic fast travel between stops, cleaning IDs, cleaning arrival/departure times, route name deduplication, dropping stops with no stop times, removing undefined parent stations, and dropping trips, shapes, and routes with no stops. Certain GTFS cleaning steps were not possible in all instances, and in those cases the impacted steps were skipped. Additional work is required to further support GTFS validation and cleaning. Transport Network Routing: · “Trapped” centroids: the centroid of destination cells on very rare occasions falls on a private road/pathway. Routing to these cells cannot be performed. This greatly decreases the transport performance in comparison with the neighbouring cells. Potential solutions include interpolation based on neighbouring cells or snapping to the nearest public OSM node (and adjusting the travel time accordingly). Further development to adapt the method for this consideration is necessary. Please also visit the Python package and Docker Image GitHub issues pages for more details. How to Contribute: We hope that the public, other public sector organisations, and National Statistics Institutions can collaborate and build on these data, to help improve the international comparability of statistics and enable higher frequency and more timely comparisons. We welcome feedback and contribution either through GitHub or by contacting datacampus@ons.gov.uk.
A shapefile of gridded squares for UK urban centre 200 metre grid with following fields:id: Identifier unique to this urban centre population: Global Human Settlement Layer population estimate within 200 metre cellgeometry: Grid polygons within_uc: Whether the 200 metre cell is within the defined urban centreaccess_pop: The median sum population that can be reached from the centroid of the 200 metre cell within a 45 minute commute by walking, bus and trainproxim_pop: The sum proximal population within an 11.25 kilometre radius of the centroid of the 200 metre celltrans_perf: The transport performance of the 200 metre cell. The percentage ratio of accessible to proximal populationcity_nm: Name of the urban centrecountry_nm: Name of the country that the urban centre belongs to