Commuter car parking facilities are located close to many public transport hubs throughout NSW, and help you to connect easily to Metro, Train, Bus and Ferry services. This dataset captures the location of the current and proposed locations of the various commuter car parks in NSW. It shows the number of standard, accessible and motorcycle spaces at each location. * Standard CCP (Commuter Car Park) spaces refer to your standard length and are available for the everyday car user. * Accessible Commuter Car Park spaces are designated car spaces for users with a accessibility parking permit only. * Motorcycle spaces are designated spaces for motorcycle parking only. * 2017-2020 changes shows how many spaces were added or removed in each location (where applicable). * Planned/Future spaces shows how many standard Commuter Car Park and accessible Commuter Car Park spaces are planned for each location, but yet to have a confirmed implementation date.
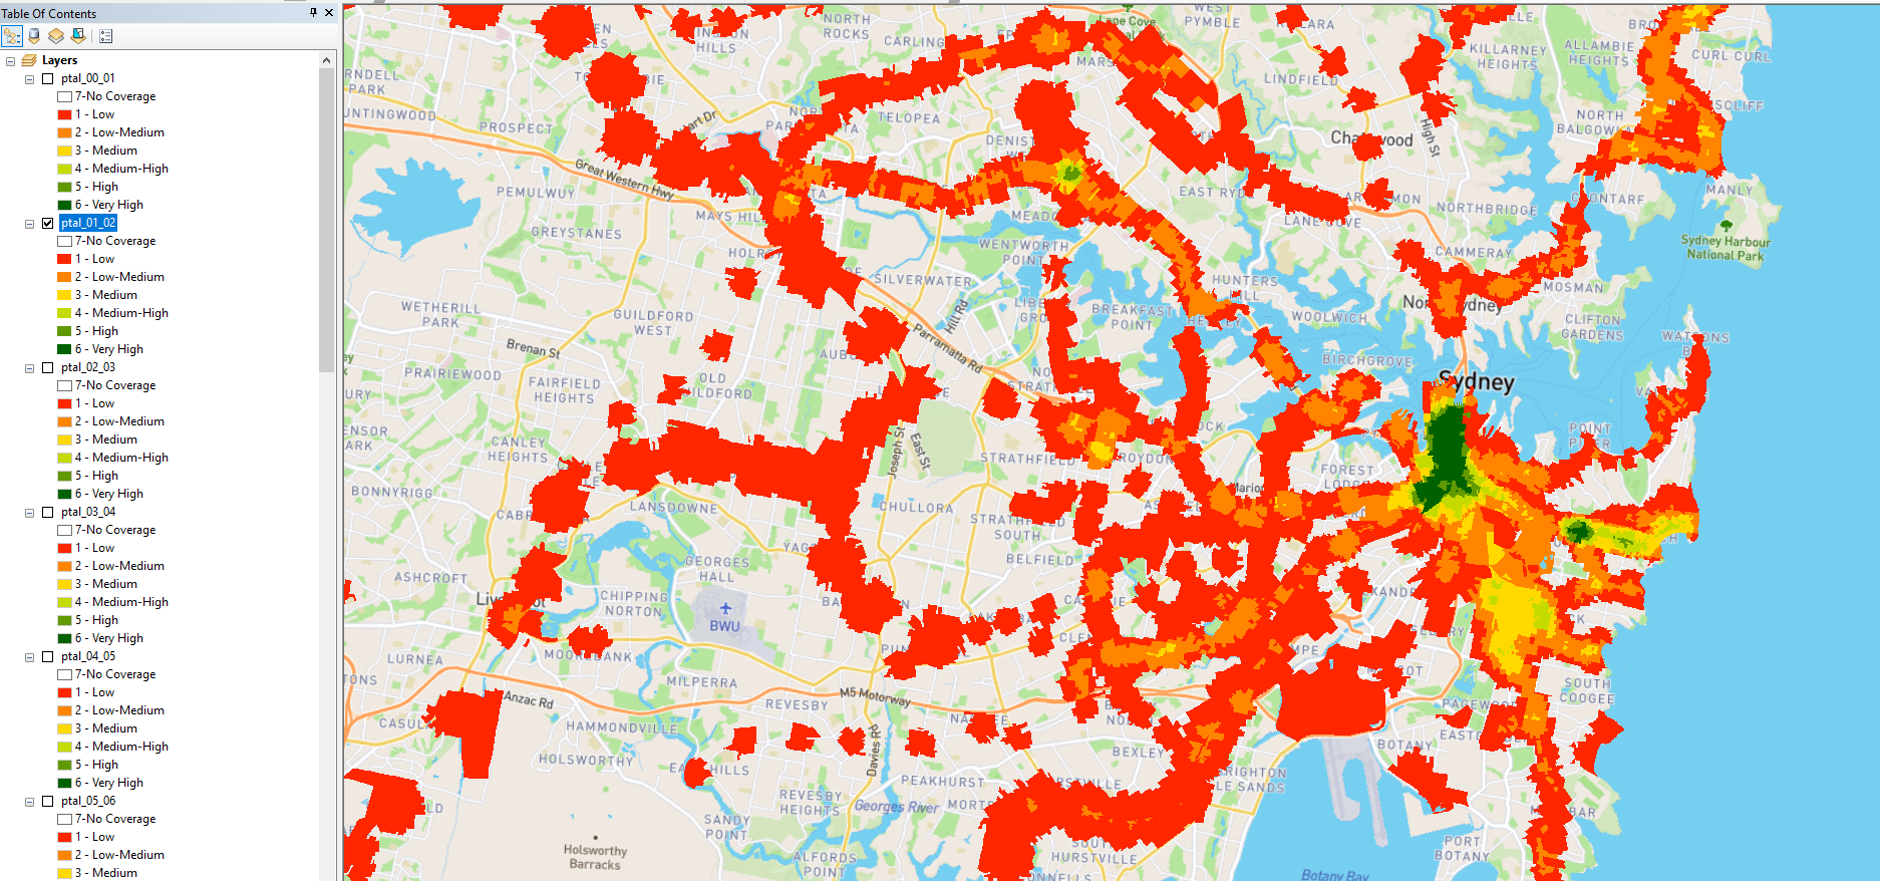
PTAL is a measure of connectivity by public transport, which has been used in various planning processes for many years. For any selected place, PTAL suggests how well the place is connected to public transport services. It does not cover trips by car. The PTAL model calculates December 2019 public transport accessibility for every 2016 ABS Mesh Block in New South Wales. The TfNSW PTAL model is based on the Transport for London (TfL) PTAL and was adapted for TfNSW in collaboration with the Spatial Information Science team at the Department of Earth and Environmental Sciences, Macquarie University. The [Assessing transport connectivity in London](http://content.tfl.gov.uk/connectivity-assessment-guide.pdf) explains what PTAL is, how to understand the data and more. PTAL values are simple. They range from zero to six, where the highest value represents the best connectivity. A location will have a higher PTAL if: \* It is at a short walking distance to the nearest stations or stops \* Waiting times at the nearest stations or stops are short \* More services pass at the nearest stations or stops \* There are major rail stations nearby \* Any combination of all the above. Please read the PTAL documentation for more information. The format of the data is Arcgis geodatabase. **Images below show an example of what the data looks like at 8:00am (first image) and 1:00am (second image)**.