Under the Federal Technology Transfer Act (FTTA), Federal Agencies can patent inventions developed during the course of research. These technologies can then be licensed to businesses or individuals for further development and sale in the marketplace. These technologies relate to monitoring and sampling air quality.
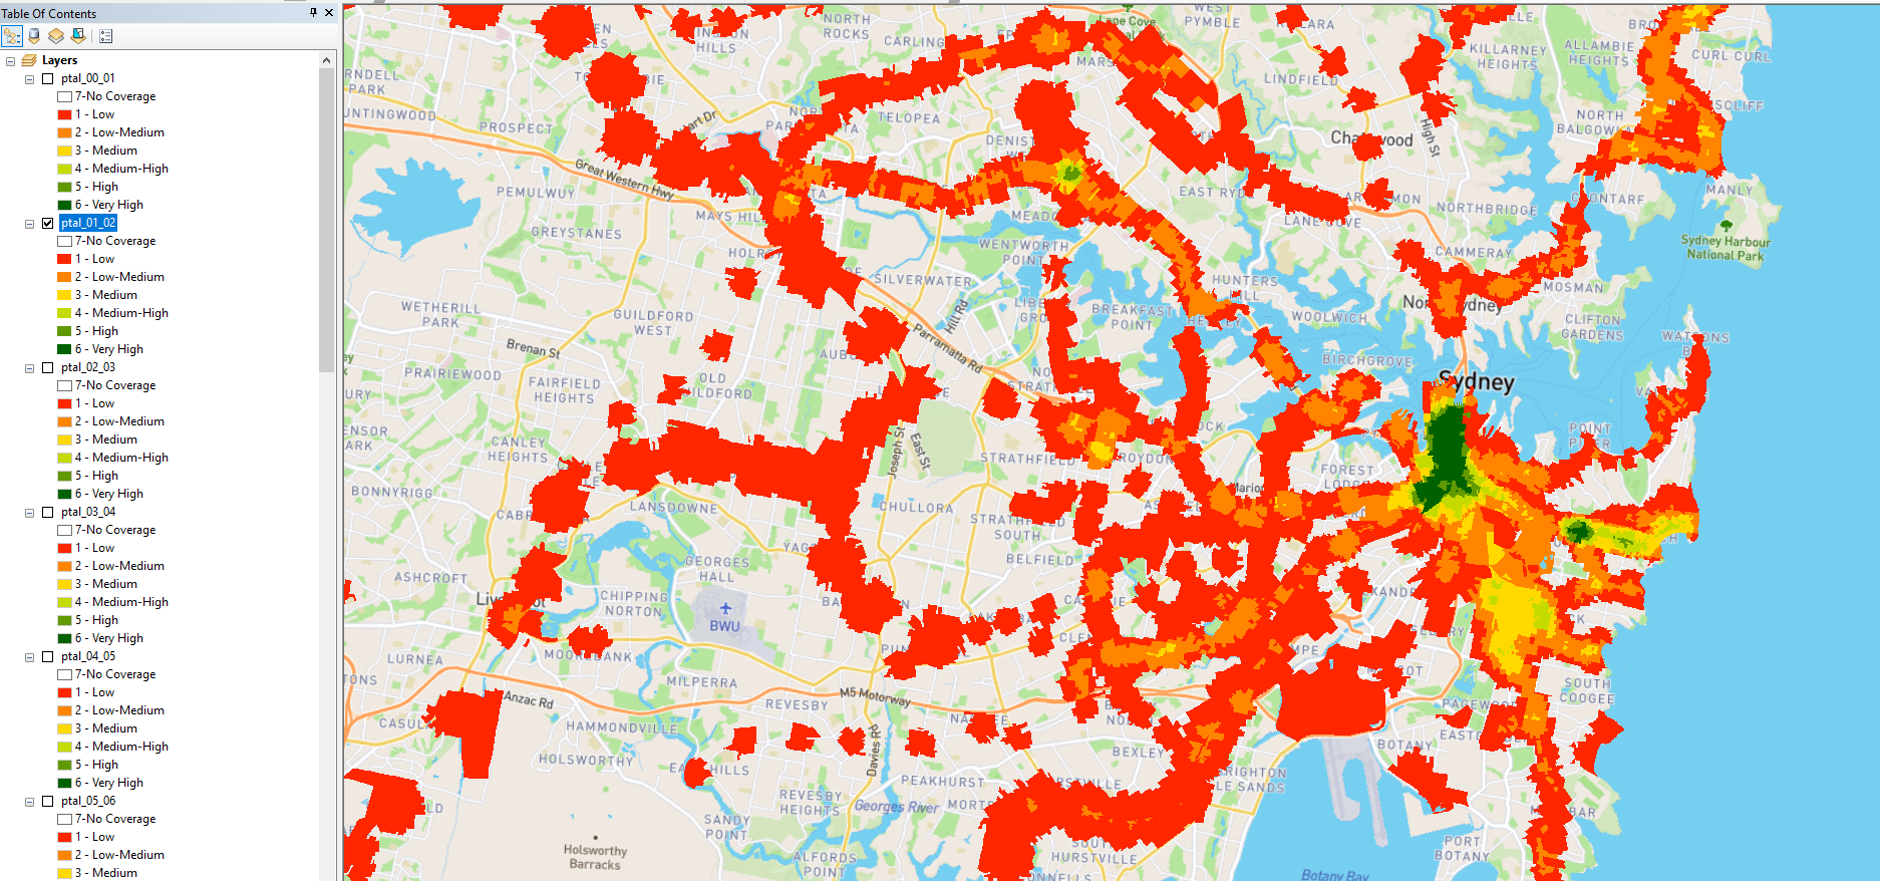
PTAL is a measure of connectivity by public transport, which has been used in various planning processes for many years. For any selected place, PTAL suggests how well the place is connected to public transport services. It does not cover trips by car. The PTAL model calculates December 2019 public transport accessibility for every 2016 ABS Mesh Block in New South Wales. The TfNSW PTAL model is based on the Transport for London (TfL) PTAL and was adapted for TfNSW in collaboration with the Spatial Information Science team at the Department of Earth and Environmental Sciences, Macquarie University. The [Assessing transport connectivity in London](http://content.tfl.gov.uk/connectivity-assessment-guide.pdf) explains what PTAL is, how to understand the data and more. PTAL values are simple. They range from zero to six, where the highest value represents the best connectivity. A location will have a higher PTAL if: \* It is at a short walking distance to the nearest stations or stops \* Waiting times at the nearest stations or stops are short \* More services pass at the nearest stations or stops \* There are major rail stations nearby \* Any combination of all the above. Please read the PTAL documentation for more information. The format of the data is Arcgis geodatabase. **Images below show an example of what the data looks like at 8:00am (first image) and 1:00am (second image)**.