Brownfields are real property, the expansion, redevelopment, or reuse of which may be complicated by the presence or potential presence of a hazardous substance, pollutant or contaminant. This dataset shows the locations of sites, facilities and properties that have been contaminated by hazardous materials and are being, or have been, cleaned up under EPA Brownfields cleanup programs.
This archived dataset contains magnetic and gravity imaging data for the Appalachian Basin, compiled using Poisson Wavelet Multiscale Edge Detection, referred to as 'worm' for brevity, and stored in a PostGIS database, along with shapefiles and CSVs of relevant data. The archive also includes regional earthquake data going back to 1973 and relevant world stress map data. These data are used in estimating the seismic hazards (both natural and induced) for candidate direct use geothermal locations in the Appalachian Basin Play Fairway Analysis by Jordan et al. (2015).
This collection of files are part of a larger dataset uploaded in support of Low Temperature Geothermal Play Fairway Analysis for the Appalachian Basin (GPFA-AB). Phase 1 of the GPFA-AB project identified potential Geothermal Play Fairways within the Appalachian basin of Pennsylvania, West Virginia and New York. This was accomplished through analysis of 4 key criteria: thermal quality, natural reservoir productivity, risk of seismicity, and heat utilization. Each of these analyses represent a distinct project task, with the fifth task encompassing combination of the 4 risks factors. Supporting data for all five tasks has been uploaded into the Geothermal Data Repository node of the National Geothermal Data System (NGDS). This submission comprises the data for Thermal Quality Analysis (project task 1) and includes all of the necessary shapefiles, rasters, datasets, code, and references to code repositories that were used to create the thermal resource and risk factor maps as part of the GPFA-AB project. The identified Geothermal Play Fairways are also provided with the larger dataset. Figures (.png) are provided as examples of the shapefiles and rasters. The regional standardized 1 square km grid used in the project is also provided as points (cell centers), polygons, and as a raster. Two ArcGIS toolboxes are available: 1) RegionalGridModels.tbx for creating resource and risk factor maps on the standardized grid, and 2) ThermalRiskFactorModels.tbx for use in making the thermal resource maps and cross sections. These toolboxes contain item description documentation for each model within the toolbox, and for the toolbox itself. This submission also contains three R scripts: 1) AddNewSeisFields.R to add seismic risk data to attribute tables of seismic risk, 2) StratifiedKrigingInterpolation.R for the interpolations used in the thermal resource analysis, and 3) LeaveOneOutCrossValidation.R for the cross validations used in the thermal interpolations. Some file descriptions make reference to various 'memos'. These are contained within the final report submitted October 16, 2015. Each zipped file in the submission contains an 'about' document describing the full Thermal Quality Analysis content available, along with key sources, authors, citation, use guidelines, and assumptions, with the specific file(s) contained within the .zip file highlighted. UPDATE: Newer version of the Thermal Quality Analysis has been added here: https://gdr.openei.org/submissions/879 (Also linked below) Newer version of the Combined Risk Factor Analysis has been added here: https://gdr.openei.org/submissions/880 (Also linked below)
Basal Cambrian project GIS files were created based on outputs from the project’s geologic model. These files represent generalized characteristics of the Cambro-Ordovician Saline System (COSS) and are influenced by the model’s grid cell size, and, as a result, these data layers should not be used as an absolute value at any particular location.
This downloadable data package contains information about Concentrated Animal Feeding Operations (CAFOs) per US County in 2013. It contains the following map layer: An ESRI polygon layer which depicts the boundaries of each US county. It has been joined with a US EPA value-added dataset derived from the 2007 USDA Census of Agriculture. This USDA dataset was procured for EPA through the Office of Water (OW). Included in this package are a shapefile (v. 10.0), Esri ArcMap map document (v. 10.0) and XML files for this record and the layer level metadata. Internet Archive URL: https://web.archive.org/web/*/https://catalog.data.gov/dataset/concentrated-animal-feeding-operations-cafos-per-county-downloadable-package-us-2013-us-epa
EDX is the Department of Energy (DOE)/Fossil Energy Carbon Management (FECM) virtual library and data laboratory built to find, connect, curate, use and re-use data to advance fossil energy and environmental R&D. Developed and maintained by the National Energy Technology Laboratory (NETL), EDX supports the entire life cycle of data by offering secure, private collaborative workspaces for ongoing research projects until they mature and become catalogued, curated, and published. EDX adheres to DOE Cyber policies as well as domestic and international standards for data curation and citation. This ensures data products pushed public via EDX are afforded a citation for proper accreditation and complies with journal publication requirements.
A zip file containing two ArcGIS polygons of the FORGE site located in Fallon, Nevada. FallonFORGE3DGeologicModelRange is the 3D geologic model range and FallonFORGESite is the FORGE site location.
This dataset contains a variety of data about the Fort Bliss geothermal area, part of the southern portion of the Tularosa Basin, New Mexico. The dataset contains schematic models for the McGregor Geothermal System, a shallow temperature survey of the Fort Bliss geothermal area. The dataset also contains Century OH logs, a full temperature profile, and complete logs from well RMI 56-5, including resistivity and porosity data, drill logs with drill rate, depth, lithology, mineralogy, fractures, temperature, pit total, gases, and descriptions among other measurements as well as CDL, CNL, DIL, GR Caliper and Temperature files. A shallow (2 meter depth) temperature survey of the Fort Bliss geothermal area with 63 data points is also included. Two cross sections through the Fort Bliss area, also included, show well position and depth. The surface map included shows faults and well spatial distribution. Inferred and observed fault distributions from gravity surveys around the Fort Bliss geothermal area.
Online web mapping tool for visualization and simple analysis of Earth-energy data files from public and DOE related sources. Geocube allows users to upload and visualize their own datasets but also comes preloaded with individual spatial datasets as well as spatial data collections that align to topical themes.
Geologic map data in shapefile format that includes faults, unit contacts, unit polygons, attitudes of strata and faults, and surficial geothermal features. 5 cross-sections in Adobe Illustrator format. Comprehensive catalogue of drill-hole data in spreadsheet, shapefile, and Geosoft database formats. Includes XYZ locations of well heads, year drilled, type of well, operator, total depths, well path data (deviations), lithology logs, and temperature data. 3D model constructed with EarthVision using geologic map data, cross-sections, drill-hole data, and geophysics.
All datasets and products specific to the Carson Sink Basin. Includes a packed ArcMap (.mpk), individually zipped shapefiles, and a file geodatabase for the Carson Sink area; a GeoSoft Oasis montaj project containing GM-SYS 2D gravity profiles along the trace of our seismic reflection lines; a 3D model in EarthVision; spreadsheet of links to published maps; and spreadsheets of well data.
Outline of Hawaiian islands (Kauai, Oahu, Molokai, Kahoolawe, Lanai, Maui, Hawaii) generated from the Geologic Map of the State of Hawaii published by the USGS in 2007.
Faults combined from USGS 2007 Geologic Map of the State of Hawaii and the USGS Quaternary Fault and Fold database. This data is in shapefile format.
Rifts mapped through reviewing the location of dikes and vents on the USGS 2007 Geologic Map of the State of Hawaii, as well as our assessment of topography, and, to a small extent, gravity data. Data is in shapefile format.
Recharge data for Hawaii Island in shapefile format. The data are from the following sources: Whittier, R.B and A.I. El-Kadi. 2014. Human Health and Environmental Risk Ranking of On-Site Sewage Disposal systems for the Hawaiian Islands of Kauai, Molokai, Maui, and Hawaii - Final, Prepared for Hawaii Dept. of Health, Safe Drinking Water Branch by the University of Hawaii, Dept. of Geology and Geophysics. Oki, D. S. 1999. Geohydrology and Numerical Simulation of the Ground-Water Flow System of Kona, Island of Hawaii. U.S. Water-Resources Investigation Report: 99-4073. Oki, D. S. 2002. Reassessment of Ground-water Recharge and Simulated Ground-Water Availability for the Hawi Area of North Kohala, Hawaii. U.S. Geological Survey Water-Resources Investigation report 02-4006.
*These files add to and replace same-named files found within Submission 559 (hover over file display names to see actual file names in bottom-left corner of screen)* The files included in this submission contain all data pertinent to the methods and results of a cohesive multi-state analysis of all known potential geothermal reservoirs in sedimentary rocks in the Appalachian Basin region, ranked by their potential favorability. Favorability is quantified using three metrics: Reservoir Productivity Index for water; Reservoir Productivity Index; Reservoir Flow Capacity. The metrics are explained in the Reservoirs Methodology Memo (included in zip file). The product represents a minimum spatial extent of potential sedimentary rock geothermal reservoirs. Only natural porosity and permeability were analyzed. Shapefile and images of the spatial distributions of these reservoir quality metrics and of the uncertainty on these metrics are included as well. UPDATE: Accompanying geologic reservoirs data may be found at: https://gdr.openei.org/submissions/881 (linked below).
Shapefile for the TfNSW bicycle network maintained by Roads and Maritime Services. This dataset is automatically updated monthly when changes occur.
Compilation of data (spreadsheet and shapefiles) for several low-temperature resource types, including isolated springs and wells, delineated area convection systems, sedimentary basins and coastal plains sedimentary systems. For each system, we include estimates of the accessible resource base, mean extractable resource and beneficial heat. Data compiled from USGS and other sources. General locations are provided in the spreadsheet; specific locations are provided in the associated shapefiles. The paper (submitted to GRC 2016) describing the methodology and analysis is also included.
This dataset contains the major event bus routes to and from Sydney Olympic Park.
This submission includes composite risk segment models in raster format for permeability, heat of the earth, and MT, as well as the final PFA model of geothermal exploration risk in Southwestern Utah, USA. Additionally, this submission has data regarding hydrothermally altered areas, and opal sinter deposits in the study area. All of this information lends to the understanding and exploration for hidden geothermal systems in the area.
Contains the latest Metro / Outer Metro Bus contract boundaries in a shapefile format This dataset is the shapefile equivalent to the pdf maps in the [Opal Trips - Bus](https://opendata.transport.nsw.gov.au/dataset/opal-trips-bus) dataset
NOAA weather and atmosphere information; many of the National Weather Service data sets are available in formats that are able to be imported directly into Geographic Information Systems (GIS). Data formats include downloadable shapefiles, web services and even KML files.
The files included in this submission contain all data pertinent to the methods and results of this task's output, which is a cohesive multi-state map of all known potential geothermal reservoirs in our region, ranked by their potential favorability. Favorability is quantified using a new metric, Reservoir Productivity Index, as explained in the Reservoirs Methodology Memo (included in zip file). Shapefile and images of the Reservoir Productivity and Reservoir Uncertainty are included as well (hover over file display names to see actual file names in bottom-left corner of screen).
All datasets and products specific to the Steptoe Valley model area. Includes a packed ArcMap project (.mpk), individually zipped shapefiles, and a file geodatabase for the northern Steptoe Valley area; a GeoSoft Oasis montaj project containing GM-SYS 2D gravity profiles along the trace of our seismic reflection lines; a 3D model in EarthVision; spreadsheet of links to published maps; and spreadsheets of well data.
This submission contains information used to compute the risk factors for the GPFA-AB project. The risk factors are natural reservoir quality, thermal resource quality, potential for induced seismicity, and utilization. The methods used to combine the risk factors included taking the product, sum, and minimum of the four risk factors. The files are divided into images, rasters, shapefiles, and supporting information. The image files show what the raster and shapefiles should look like. The raster files contain the input risk factors, calculation of the scaled risk factors, and calculation of the combined risk factors. The shapefiles include definition of the fairways, definition of the US Census Places, the center of the raster cells, and locations of industries. Supporting information contains details of the calculations or processing used in generating the files. An image of the raster will have the same name except *.png as the file ending instead of *.tif. Images with 'fairways' or 'industries' added to the name are composed of a raster with the relevant shapefile added. The file About_GPFA-AB_Phase1RiskAnalysisTask5DataUpload.pdf contains information the citation, special use considerations, authorship, etc. ***See 'GPFA-AB.zip' at bottom for compressed and organized version of the files associated with this submission*** **More details (including location) on each file are given in the spreadsheet 'list_of_contents.csv' in the folder 'SupportingInfo'** Code used to calculate values is available: https://github.com/calvinwhealton/geothermal_pfa under the folder 'combining_metrics' - *See link below*
This submission contains a link to two USGS data publications. Each data release contains all digital geographic data used and produced by the Snake River Plain Play Fairway Analysis for Phase 1 and Phase 2 (ArcGIS shapefiles and raster files) as well as the model processing script, tables, and documentation used to generate data outputs. Brief descriptions of data layers are in the metadata of GIS files. Greater detail is available in the Phase 1 and Phase 2 final reports (linked below). The citations for the favorability model data products are: Phase 1 DeAngelo, J., Shervais, J.W., Glen, J.M., Dobson, P.F., Liberty, L.M., Siler, D.L., Neupane, G., Newell, D.L., Evans, J.P., Gasperikova, E., Peacock, J.R., Sonnenthal, E., Nielson, D.L., Garg, S.K., Schermerhorn, W.D., and Earney, T.E., 2021, Snake River Plain Play Fairway Analysis Phase 1 Favorability Model (DE EE0006733): U.S. Geological Survey data release, https://doi.org/10.5066/P95EULTI. Phase 2 DeAngelo, J., Shervais, J.W., Glen, J.M., Dobson, P.F., Liberty, L.M., Siler, D.L., Neupane, G., Newell, D.L., Evans, J.P., Gasperikova, E., Peacock, J.R., Sonnenthal, E., Nielson, D.L., Garg, S.K., Schermerhorn, W.D., and Earney, T.E., 2021, Snake River Plain Play Fairway Analysis Phase 2 Favorability Model (DE EE0006733): U.S. Geological Survey data release, https://doi.org/10.5066/P9Y8MEZY.
Comprehensive catalogue of drill-hole data in spreadsheet, shapefile, and Geosoft database formats. Includes XYZ locations of well heads, year drilled, type of well, operator, total depths, well path data (deviations), lithology logs, and temperature data. Plus, 13 cross-sections in Adobe Illustrator format.
This data provides monthly average and annual average daily total solar resource averaged over surface cells of 0.1 degrees in both latitude and longitude, or about 10 km in size. This data was developed using the State University of New York/Albany satellite radiation model. This model was developed by Dr. Richard Perez and collaborators at the National Renewable Energy Laboratory and other universities for the U.S. Department of Energy. Spatial extent: * 10-km includes lower 48 states and Hawaii * 40-km includes lower 48, AK and HI. Includes shapefiles, .kmz, metadata. Data is called "Dynamic maps, GIS data & Analysis tools" in Archivers app (as of 2/25/2017). Internet Archive URL: https://web.archive.org/web/2019*/http://www.nrel.gov/gis/data_solar.html
This dataset will no longer be updated. Please use [GTFS-Flex v2](https://opendata.transport.nsw.gov.au/dataset/on-demand-timetables-gtfs) for On Demand boundaries. Basic Polygon layer for On Demand Bus regions that operate around NSW. These are used in the .info Trip Planner. An example of how it is used is shown below: 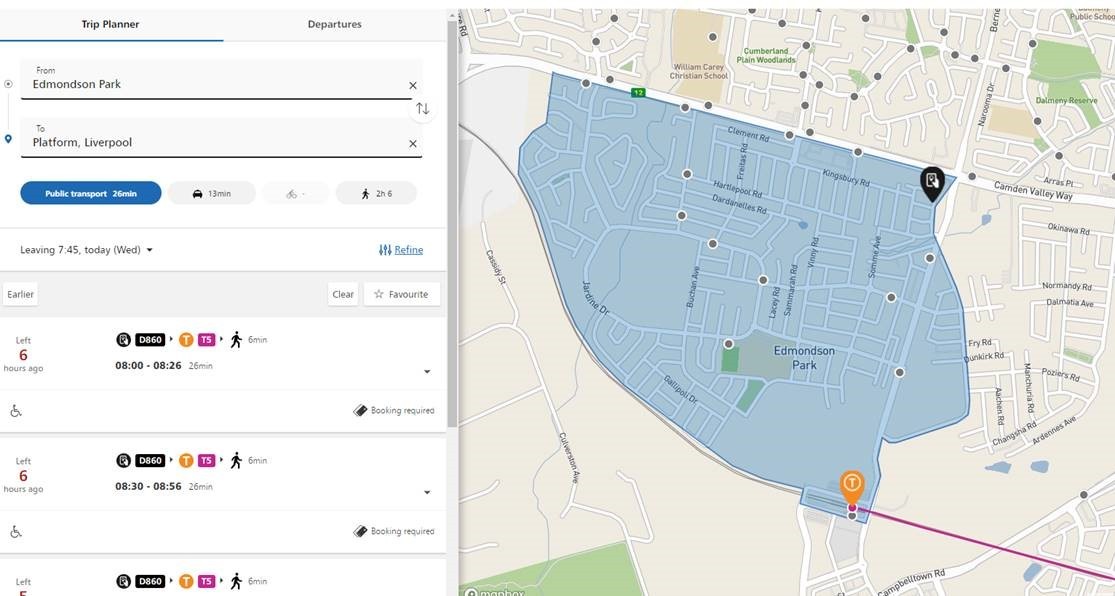
This submission includes raster datasets for each layer of evidence used for weights of evidence analysis as well as the deterministic play fairway analysis (PFA). Data representative of heat, permeability and groundwater comprises some of the raster datasets. Additionally, the final deterministic PFA model is provided along with a certainty model. All of these datasets are best used with an ArcGIS software package, specifically Spatial Data Modeler.
This submission contains several shapefiles used for a deterministic PFA, as well as a heat composite risk segment with union overlay, and training sites used for weights of evidence. More detailed metadata can be found in the specific file.
This is a digitized geologic map, in shapefile format, including rock unit lithological descriptions, faults, and dikes.
In this submission is the groundwater composite risk segment (CRS) used for play fairway analysis. Also included is a heat flow probability map, and a shaded relief map of the Tularosa Basin, NM.
This submission includes a geotiff of the geographic extent of Pleistocene Lake Otero; which was used as apart of the groundwater composite risk segment in a Tularosa Basin Play Fairway Analysis.
This submission contains multiple excel spreadsheets and associated written reports. The datasets area are representative of shallow temperature, geochemistry, and other well logging observations made across WSMR (white sands missile range); located to the west of the Tularosa Basin but still within the study area. Written reports accompany some of the datasets, and they provide ample description of the methodology and results obtained from these studies. Gravity data is also included, as point data in a shapefile, along with a written report describing that particular study.
This shapefile contains 409 well data points on Tularosa Basin Water Chemistry, each of which have a location (UTM), temperature, quartz and Potassium/Magnesium geothermometer; as well as concentrations of chemicals like Mn, Fe, Ba, Sr, Cs, Rb, As, NH4, HCO3, SO4, F, Cl, B, SiO2, Mg, Ca, K, Na, and Li.
Easy access to census data in map, KML, shapefile, and other formats. Could be used for GIS mapping.
Shapefile of shallow, low-temperature EGS resources for the United States, and accompanying paper (submitted to GRC 2016) describing the methodology and analysis. These data are part of a very rough estimate created for use in the U.S. Department of Energy Geothermal Technology Office's Vision Study. They are not a robust estimate of low-temperature EGS resources in the U.S, and should be used accordingly.
This is a GIS point feature shapefile representing wells, and their temperatures, that are located in the general Utah FORGE area near Milford, Utah. There are also fields that represent interpolated temperature values at depths of 200 m, 1000 m, 2000 m, 3000 m, and 4000 m. in degrees Fahrenheit. The temperature values at specific depths as mentioned above were derived as follows. In cases where the well reached a given depth (200 m and 1, 2, 3, or 4 km), the temperature is the measured temperature. For the shallower wells (and at deeper depths in the wells reaching one or more of the target depths), temperatures were extrapolated from the temperature-depth profiles that appeared to have stable (re-equilibrated after drilling) and linear profiles within the conductive regime (i.e. below the water table or other convective influences such as shallow hydrothermal outflow from the Roosevelt Hydrothermal System). Measured temperatures/gradients from deeper wells (when available and reasonably close to a given well) were used to help constrain the extrapolation to greater depths. Most of the field names in the attribute table are intuitive, however HF = heat flow, intercept = the temperature at the surface (x-axis of the temperature-depth plots) based on the linear segment of the plot that was used to extrapolate the temperature profiles to greater depths, and depth_m is the total well depth. This information is also present in the shapefile metadata.
This archive contains a geology map of the general Roosevelt Hot Springs region, both in PDF and ArcGIS geodatabase formats, that was created as part of the Utah FORGE project.
This submission includes two modeled drawdown scenarios with new supply well locations, a total dissolved solids (TDS) concentration grid (raster dataset representing the spatial distribution of TDS), and an excel spreadsheet containing well data.
This submission contains a shapefile of heat flow contour lines around the FORGE site located in Milford, Utah. The model was interpolated from data points in the Milford_wells shapefile. This heat flow model was interpolated from 66 data points using the kriging method in Geostatistical Analyst tool of ArcGIS. The resulting model was smoothed 100%. The well dataset contains 59 wells from various sources, with lat/long coordinates, temperature, quality, basement depth, and heat flow. This data was used to make models of the specific characteristics.
There are two zipped folders in this submission. One contains a shapefile with the position of MT stations around the Milford FORGE Site, while the other has the raw MT data.
This is a zipped GIS compatible shapefile of gravity data points used in the Milford, Utah FORGE project as of March 21st, 2016. The shapefile is native to ArcGIS, but can be used with many GIS software packages. Additionally, there is a .dbf (dBase) file that contains the dataset which can be read with Microsoft Excel. The Data was downloaded from the PACES (Pan American Center for Earth and Environmental Studies) hosted by University of Texas El Paso. A readme file is included in the archive with abbreviation explanations and units.
This submission includes the geographic extent shapefile of the Milford FORGE site located in Utah, along with a shapefile of seismometer positions throughout the area, and models of basin depth and potentiometric contours.
Three shapefiles in this submission show the position of proposed seismic line surveys. The mid-crustal velocity anomaly file shows the extent of an anomalously low P-wave velocity zone in the subsurface. Two other files show the extent of known hydrothermal systems in the Roosevelt Hot Springs area. Another file shows the location of the proposed water pipeline to pump water from the supply wells to the deep drill site.
This submission includes a gravity data in text format and as a GIS point shapefile and transient electromagnetic (TEM) raw data. Each text file additionally contains location data (UTM Zone 12, NAD83) and elevation (meters) data for that station. The gravity data shapefile was in part downloaded from PACES, University of Texas at El Paso, http://gis.utep.edu/subpages/GMData.html, and in part collected by the Utah Geological Survey (UGS) as part of the DOE GTO supported Utah FORGE geothermal energy project near Milford, Utah. The PACES data were examined and scrubbed to eliminate any questionable data. A 2.67 g/cm^3 reduction density was used for the Bouguer correction. The attribute table column headers for the gravity data shapefile are explained below. There is also metadata attached to the GIS shapefile. name: the individual gravity station name. HAE: height above ellipsoid [meter] NGVD29: vertical datum for geoid [meter] obs: observed gravity ERRG: gravity measurement error [mGal] IZTC: inner zone terrain correction [mGal] OZTC: outer zone terrain correction [mGal] Gfa: free air gravity gSBGA: Bouguer horizontal slab sCBGA: Complete Bouguer anomaly
This submission contains several ArcGIS shapefiles, each with Temperature contour lines at different depths. Subsurface temperature were important for characterizing the geothermal system beneath the FORGE site in Milford, Utah.
The individual shapefiles in this dataset delineate estimated temperature contours (20, 40, 60, and 80 deg C) at a depth of 200 m in the Milford, Utah FORGE area. Contours were derived from 86 geothermal, gradient, and other wells drilled in the area since the mid-1970s with depths greater than 50 m. Conductive temperature profiles for wells less than 200 m were extrapolated to determine the temperature at the desired depth. Because 11 wells in the eastern section of the study area (in and around the Mineral Mountains) are at higher elevations compared to those closer to the center of the basin, temperature profiles were extrapolated to a constant elevation of 200 m below the 1830 m (6000 ft) a.s.l. datum (approximate elevation of alluvial fans at the base of the Mineral Mountains) to smooth the contours across the ridges and valleys.
Geologic ArcGIS data of West Flank Coso, Ca FORGE site from a unpublished map by Rich Whitmarsh. The zip file includes a DEM, hillshade and four shapefiles of the general outlines of FORGE area.