Your one-stop shop for all things active transport. Active transport provides tangible benefits by increasing daily physical activity levels and reducing greenhouse gas emissions through a reduction in cars on the road. Other benefits include improved social well-being and a greater sense of community. This data set contains links to the various data sets available on the Open Data Hub that relate to Active Transport. * [Cycling Data](https://opendata.transport.nsw.gov.au/dataset/cycling-data) * [Pop Up Cycleway](https://opendata.transport.nsw.gov.au/dataset/pop-cycleway) * [Cycling Propensity](https://opendata.transport.nsw.gov.au/dataset/cycling-propensity) * [Cycling Count](https://opendata.transport.nsw.gov.au/dataset/cycling-count) * [Cycle Network - City of Sydney](https://opendata.transport.nsw.gov.au/dataset/cycle-network-city-sydney) * [Cycleway Data](https://opendata.transport.nsw.gov.au/dataset/cycleway-data) * [Sydney Spring Cycle 2017 - Road Closures](https://opendata.transport.nsw.gov.au/dataset/sydney-spring-cycle-2017-road-closures) * [Active Transport: Cycling](https://opendata.transport.nsw.gov.au/dataset/active-transport-cycling) * [Smart Pedestrian Project](https://opendata.transport.nsw.gov.au/dataset/smart-pedestrian-project) * [Active Transport: Walking](https://opendata.transport.nsw.gov.au/dataset/active-transport-walking) * [Smart Cities Macquarie Park](https://opendata.transport.nsw.gov.au/dataset/smart-cities-macquarie-park) * [Walking Count Sites](https://opendata.transport.nsw.gov.au/dataset/walking-count-sites) * [Eurobodalla Shire Council Cycleway](https://opendata.transport.nsw.gov.au/dataset/eurobodalla-shire-council-cycleway) * [UNSW Bicycling Dashboards](https://opendata.transport.nsw.gov.au/dataset/unsw-bicycling-dashboards)
This data explores the nature of walk trips in Sydney. The walking data featured here are from the Household Travel Survey (HTS), which is the largest and most comprehensive source of personal travel data for the Sydney Greater Metropolitan Area (GMA). The HTS collects data for all transport modes including walking.
This dataset includes the open data sets we have about cycling and bicycle counts and includes the following data: * **[Popup Cycleway](https://opendata.transport.nsw.gov.au/dataset/pop-cycleway)** The Popup Cycleway data includes six popup cycleways in key commuter areas across the city to promote walking and cycling. It's part of a set of initiatives developed across the Sydney region to provide people more options to safely walk, cycle and commute to work in 2020. More cycleway (bike paths) data can be referenced from the [Cycleway Finder](https://www.rms.nsw.gov.au/maps/cycleway_finder) and [Open Street Map](https://www.openstreetmap.org/#map=4/-28.15/133.28). * **[Cycling count](https://opendata.transport.nsw.gov.au/dataset/cycling-count)** The Cycling count data contains the data for different local government area (LGA). The City of Sydney has conducted twice yearly intersection cycle counts at various sites in peak hours (6-9 am and 4-7 pm) on one day in March and October every year, since March 2010 (excluding March 2018). This data is consolidated to provide a total number of cyclists at the site during peak hours. * **[Cycleway Data](https://opendata.transport.nsw.gov.au/dataset/cycleway-data)** The Cycleway infrastructure data is a database of the cycleway infrastructure located throughout NSW and maintained by Roads and Maritime Services (RMS). * **[Active Transport: Cycling](https://opendata.transport.nsw.gov.au/dataset/active-transport-cycling)** The information featured here include data from the Sydney Cycling Survey (SCS). The SCS surveys over 11,000 individuals from 4,000 households. It collects information about cyclists, cycling trips, cycling participation and cycling mode share. Publications about cycling using data from the Household Travel Survey, Census of Population and Housing, and bicycle counters are also available. * **[Cycle Network - City of Sydney](https://opendata.transport.nsw.gov.au/dataset/cycle-network-city-sydney)** Existing, rideable bicycle routes through the City of Sydney local government area for bicycle commuters. For more information visit [City of Sydney](https://data.cityofsydney.nsw.gov.au/search). * **[Cycling Propensity](https://opendata.transport.nsw.gov.au/dataset/cycling-propensity)** This dataset contains the propensity index for cycling across different areas. It also contains the report that examines spatial relationship between areas with high propensity for cycling with high concentrations of short distance car trips.
This data is part of the strategic transport modelling undertaken for Outer Urban Public Transport Maps, which was released in October 2018. The [Outer Urban Public Transport Maps](https://www.infrastructureaustralia.gov.au/outer-urban-public-transport-maps-sydney) showcases through interactive maps, the comparative public transport network performance for Greater Sydney. The following resources are available, links have been provided that direct you to the current source of data. **Walking access to medium- to high-frequency public transport** This layer presents the proportion of people within walking distance to high-medium frequency public transport stops/stations in 2017. Walking distance is defined as 800 metres for heavy rail, and 400 metres for all other modes. High-frequency public transport is defined as having at least four services per hour during AM peak. This analysis was performed using 2017 timetables. **Public transport travel times to Sydney CBD** This layer presents travel times, by public transport during AM peak, to a series of destinations. This analysis was performed using 2017 public transport timetables. The layers represents the geographical extent of the inner, middle, and outer sectors used to perform the analysis in the report. **Public transport service frequency** This layer presents public transport stop frequency during weekday AM peak (8-9am) and weekday off peak (11am-12am). This analysis was performed using 2017 public transport timetables.
Macquarie University and the City of Ryde Council installed pedestrian-counting sensors throughout Macquarie Park, as part of a project to ease congestion in the growing education, residential, retail and business hub. The pedestrian counters monitored pedestrian flow and blockages, and the data will be used to improve safety and connectivity to transport services. Historical transport, parking and pedestrian data are consolidated on an open-source platform to inform planners and local businesses across Macquarie Park. A dashboard to view the data can be found at [http://smartcity-api.science.mq.edu.au/](http://smartcity-api.science.mq.edu.au/) The raw data that makes up the dashboard is available below.
Thirty Minute City and Metro Strategic Centre Catchments is a foundation of the [Future Transport Strategy](https://future.transport.nsw.gov.au/future-transport-strategy/greater-sydney-network). Thirty Minute City establishes a metropolitan transport network which reinforces the metropolis of three cities, particularly the delivery of a 30-minute city where most residents in each city can access their metropolitan centre or cluster within 30 minutes by public transport. Metro Strategic Centre Catchments develops a network of 34 strategic centres with jobs, goods and services supported by a public transport, walking and cycling network. This would provide residents with a 30-minute public transport service to their nearest strategic centre seven days a week. The image below shows the thirty minute city catchments to the different strategic centre catchments. 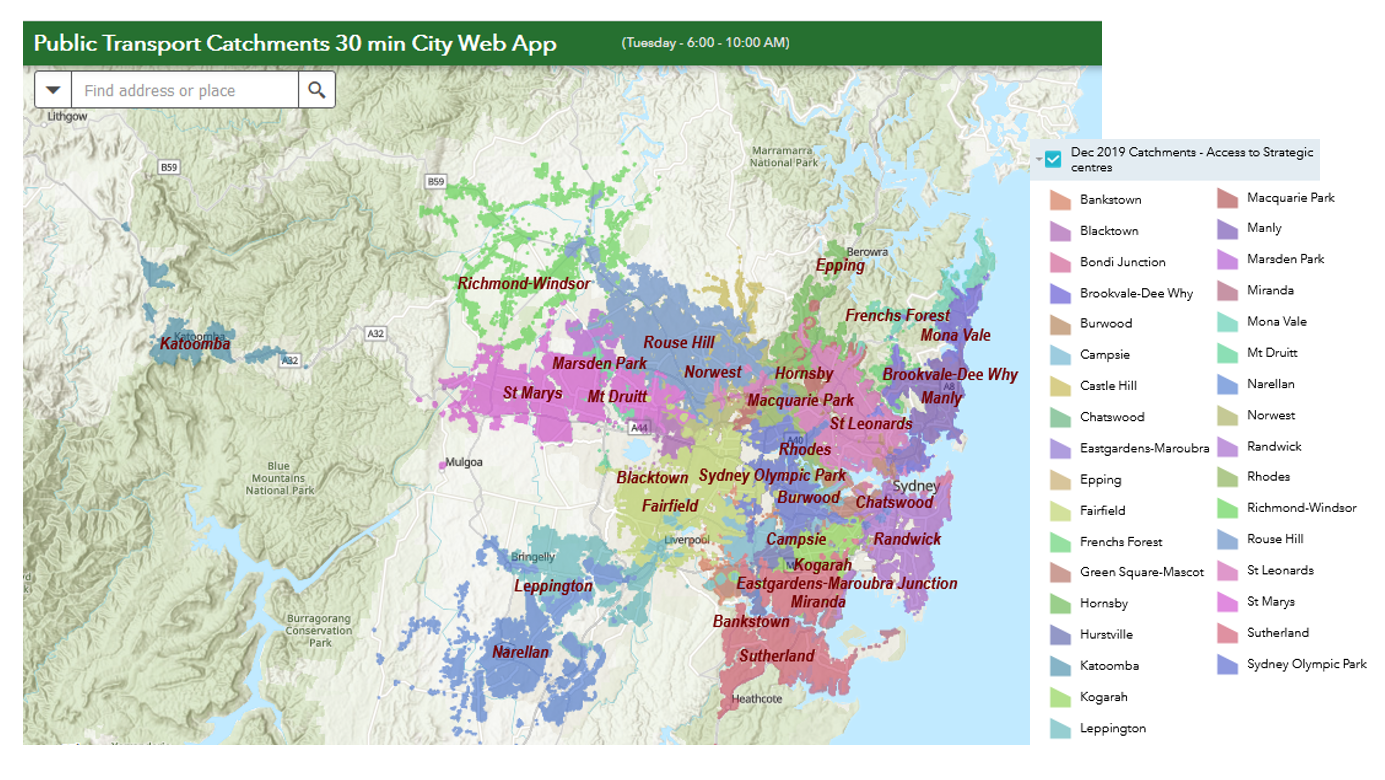 The Thirty Minute City and Metro Strategic Centre Catchments Document provides you with detailed information regards the background of this initiative and the datasets used.
Twice a year City of Sydney carry out walking count surveys to give us a picture of walking trends across the City of Sydney area. The counts take place at around 100 locations from 6am to midnight in fair weather conditions, on a weekday and a day on the weekend in March and October. The survey locations were selected based on the Liveable Green Network, such as locations of interest or where change is occurring or expected. API provides data in GeoJSON format. For more information visit https://data.cityofsydney.nsw.gov.au/datasets/318c979731e54cb187349d034e1defad_0/explore
The Walking CVP report investigate how we can encourage customers in NSW to walk more often. The reports identify 4 key areas: 1. Connectivity and flow of footpaths to public transport and centres 2. Pedestrian safety and personal security 3. Health and well being benefits 4. Supporting facilities including complete shade or rain coverage on key routes and at interchanges This report provides a detailed analysis of why the research was conducted, what influences walking in NSW, what is important to the NSW population, and how do needs differ across the NSW population.