The Newberry Volcano EGS Demonstration in central Oregon, a 5 year project begun in 2010, tests recent technological advances designed to reduce the cost of power generated by EGS in a hot, dry well (NWG 55-29) drilled in 2008. First, the stimulation pumps used were designed to run for weeks and deliver large volumes of water at moderate well-head pressure. Second, to stimulate multiple zones, AltaRock developed thermo-degradable zonal isolation materials (TZIMs) to seal off fractures in a geothermal well to stimulate secondary and tertiary fracture zones. The TZIMs degrade within weeks, resulting in an optimized injection/ production profile of the entire well. Third, the project followed a project-specific Induced Seismicity Mitigation Plan (ISMP) to evaluate, monitor for, and mitigate felt induced seismicity. An initial stimulation was conducted in 2012 and continued for 7 weeks, with over 41,000 m3 of water injected. Further analysis indicated a shallow casing leak and an unstable formation in the open hole. The well was repaired with a shallow casing tieback and perforated liner in the open hole and re-stimulated in 2014. The second stimulation started September 23rd, 2014 and continued for 3 weeks with over 9,500 m3 of water injected. The well was treated with several batches of newly tested TZIM diverter materials and a newly designed Diverter Injection Vessel Assembly (DIVA), which was the main modification to the original injection system design used in 2012. A second round of stimulation that included two perforation shots and additional batches of TZIM was conducted on November 11th, 2014 for 9 days with an additional 4,000 m3 of water injected. The stimulations resulted in a 3-4 fold increase in injectivity, and PTS data indicates partial blocking and creation of flow zones near the bottom of the well. This submission includes all of the files and reports associated with the stimulation, pressure testing, and monitoring included in the scope of the project.
- PDFDaily Reports.pdf
- datDTS Trace Data.dat
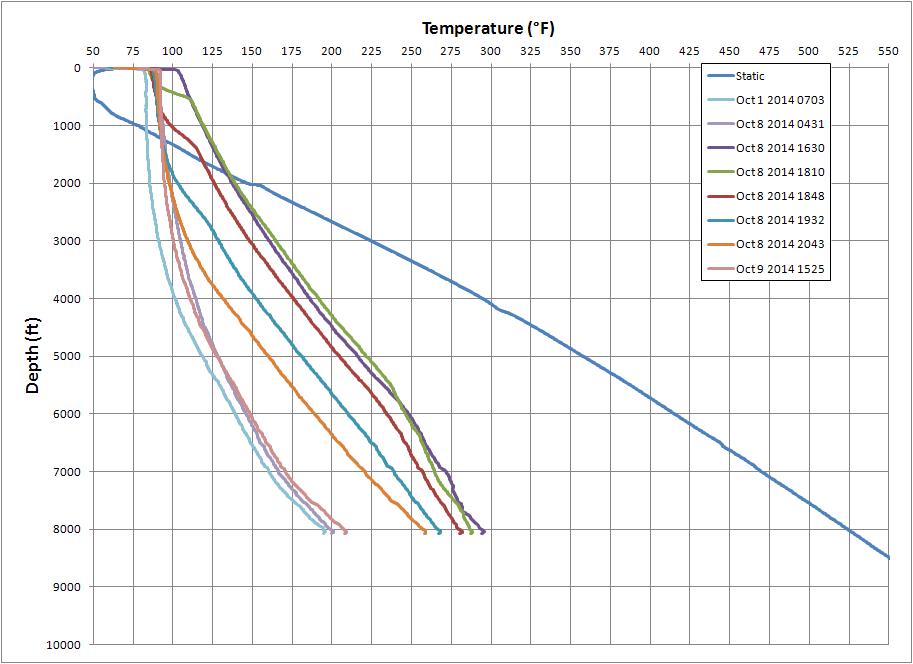
- JPEGTemperature Profile.JPG
- XLSXOctober Flow Test.xlsx
- XLSXNovember Flow Test.xlsx
- XLSXBackflow Report.xlsx
- XLSXGroundwater Average Data.xlsx
- PDFSurface Water and Groundwater Quality Data.pdf
- PDFStimulation Results 2013.pdf
- PDFProduction Well Targeting 2015.pdf
- PPTXEGS Demonstration Results Presentation 2014.pptx
- PDFEGS Demonstration Results 2015.pdf
- PDFTHMC Modeling of Stimulation 2015.pdf
- XLSXDHP - 9545 ft.xlsx
- XLSXDHP - Shoe.xlsx
- PDFPTS Survey Plots - 15_Oct_14.pdf
- XLSPTS Survey Data - 15_Oct_14.xls
- PDFPTS Survey Plots - 17_Nov_14.pdf
- XLSPTS Survey Data - 17_Nov_14.xls
- PDFPTS Survey Plots - 18_Nov_14.pdf
- XLSPTS Survey Data - 18_Nov_14.xls
- PDFPTS Survey Plots - 19_Nov_14.pdf
- XLSPTS Survey Data - 19_Nov_14.xls
- PDFPTS Survey Plots - 20_Nov_14.pdf
- XLSPTS Survey Plots - 20_Nov_14.xls
- DOCXMT Results.docx
- PDFInduced Seismicity Analysis Report.pdf
- PDFWeekly Report - 05_Nov_14.pdf
- PDFWeekly Report - 10_Oct_14.pdf
- PDFWeekly Report - 12_Nov_14.pdf
- PDFWeekly Report - 15_Oct_14.pdf
- PDFWeekly Report - 19_Nov_14.pdf
- PDFWeekly Report - 22_Oct_14.pdf
- PDFWeekly Report - 26_Nov_14.pdf
- PDFWeekly Report - 29_Oct_14.pdf
- PDF1 - ISMP V4 3Aug11_lowres.pdf
- PDFISMP Addendum.pdf
- PDFB-Value Cumulative Moments.pdf
- TXTISTI Seismic Event Locations.txt
- TXTLBNL Seismic Event Locations.txt
- relocClustered Seismic Events 02-26-2015.reloc
- relocUnclustered Seismic Events 02-26-2015.reloc
- relocClustered Seismic Events 03-11-2015.reloc
- relocNewberry NPICKS08.reloc
- relocNewberry NPICKS12.reloc
- relocNewberry NPICKS14.reloc
- relocUnclustered Seismic Events 03-11-2015.reloc
- outLLNL Best Seismic Event Locations.out
- CSVPNSN Seismic Event Locations.csv
- PDFNWG 55-29 Schematic 2014.pdf
- XLSXNewberry 2014 Datalog 1.xlsx
- XLSXNewberry 2014 Datalog 2.xlsx
- XLSXNewberry Walkaround Log.xlsx
- ZIPNewberry Well 55-29 2014.zip